Creating A Pivot Grid
- Cory Fifield

- Sep 7, 2021
- 1 min read
Updated: Sep 13, 2021
In this post I want to discuss the purpose and give an example of using the Pivot Grid control inside VDM.
What Is A Pivot Grid?
A pivot grid summarizes large amounts of data in a cross-tabular format that can be sorted, grouped and filtered. Users can also customize the pivot grid layout by simple drag-and-drop operations.
Below is a step by step example of creating a Pivot Grid inside VDM.
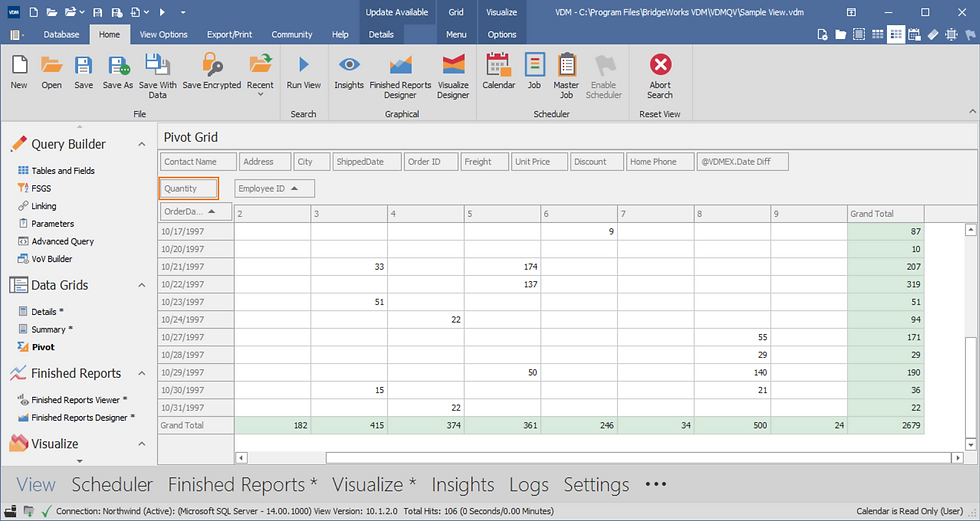
Note: The following pivot displays the Quantity (data item) for each Employee ID (column) and OrderDate (row).
1. Create and run a View.

2. Click on Pivot in the navigation bar.

3. Drag the field you want to use for the Column Field into the pivot grid Column Field section.

4. Drag the field you want to use for the Row Field into the pivot grid Row Field section.

5. Drag the field you want to use for values into the pivot grid Data Item.

6. View the results.
Note: The following pivot displays the Quantity (data item) for each Employee ID (column) and OrderDate (row).


Suppose I run a view and no fields appear at the top of the pivot grid to drag and drop?